 Analytics provide a snapshot of your website at any given time. It will tell you where your visitors are coming from and what they are doing on your site. Knowing this will help you understand what part of their actions are leading to conversions and which are not.
Analytics will also measure which parts of your content are the most engaging. Here are some benefits you’ll experience by taking the time to regularly review your website’s analytic data:
- Create better advertising campaigns
- Improve content
- Understand the behavior of your audience
- New ideas and opportunities
- Track online traffic
- Track eCommerce performance
- Consolidated reports
There are different tools out there that will track your analytics but we’re going to focus on one of the most popular, Google Analytics. This is the most popular option since Google is the biggest search engine on the internet.
What Is Google Analytics?
Google Analytics records how a user comes to your site, what actions they take on your site, and how they leave your site. Google Analytics can also measure the effectiveness of your campaigns, such as ads and emails, and any other tools.
When combined with Google Search Console, Google Analytics can give you data on how and when your website shows up in search results. This enables you to track a user from a click on the search result page all throughout your website and hopefully to an ultimate purchase.
How Does It Work?
Once you sign up for Google Analytics, you will be requested to place a bit of code on your web site. The code allows Google Analytics to record the data to measure so it’s important that the code is added to every page of your website. The information you get will then give you an idea of the demographics of your visitors, as well as their behavior.
Once Google Analytics is installed it starts tracking the following:
- User actions
- Views
- Clicks
- Pages visited
- Number of visitors
- User demographics
- And much more
Knowing all these metrics will help you understand what is working and what you should avoid to improve conversions that lead to more sales.
How To Get Started With Google Analytics
Setting Up Google Analytics
You’ll need a Google Analytics account first. If you have a primary Google account that you use for other Google services such as Gmail, Google Calendar, Google Drive, or YouTube, you should use that account to set up Google Analytics. If not, you’ll have to make a new one.
To begin collecting fundamental data from a website, follow these steps:
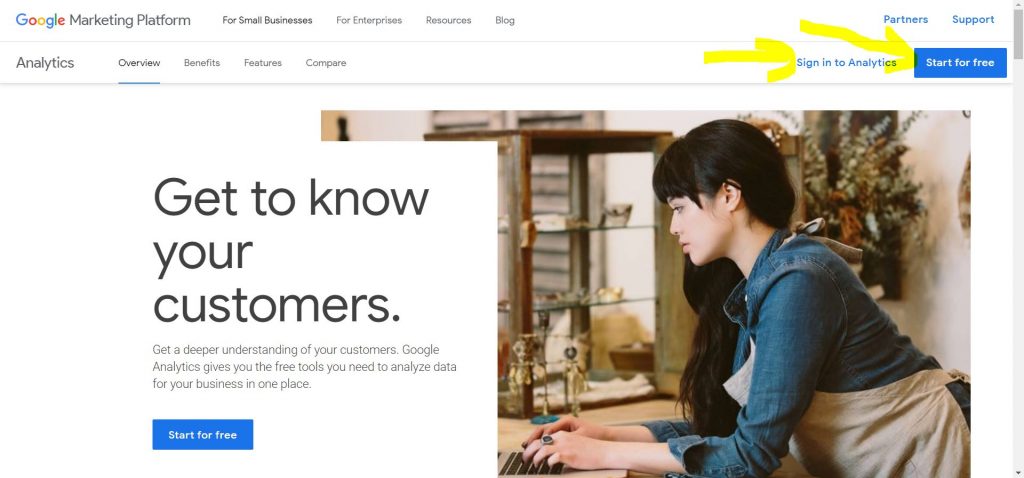
1. Register or log in to your Analytics account:
-
- Go to google.com/analytics
- Select one of the following options:
- Click “Start for free” to register for a new account.
- Click “Sign in” to Analytics to log in to your account.
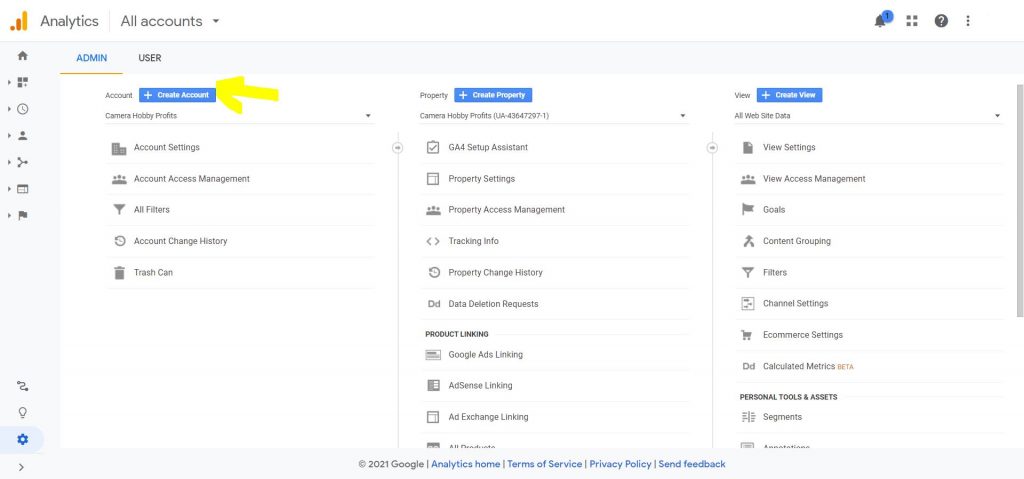
2. Create a property in your Google Analytics account. A property is the gathering spot in Analytics for information from your site or app, and it symbolizes your site or app.
-
- Go to the Admin tab once you’ve logged in.
- Now you must create an Account Name and a Property Name. Select “Create new account” from the Account drop-down menu. A single account can track numerous properties (websites).
- Choose a name for your account (Company Name), a name for your website (Website Name), and a URL for your website.
3. To gather information in your Analytics property, embed the tracking code on your website.
-
- Click “Get Tracking ID.” The Google Analytics terms and conditions will be displayed in a pop-up window which you must accept. After that, you’ll receive your Google Analytics code.
- Each page of your website must have the Google Analytics tracking code installed. The installation process will be different depending on the type of website you own.
Google Analytics will begin gathering data as soon as tracking is enabled, and within a few days, you can start reviewing reports.
Any digital marketer’s toolkit should include Google Analytics. It will assist you in tracking the success of your website as well as all of your digital marketing activities. Using Google Analytics, you’ll be able to determine your ROI and discover more about your target market.
How to Use Google Analytics to Track Website Traffic
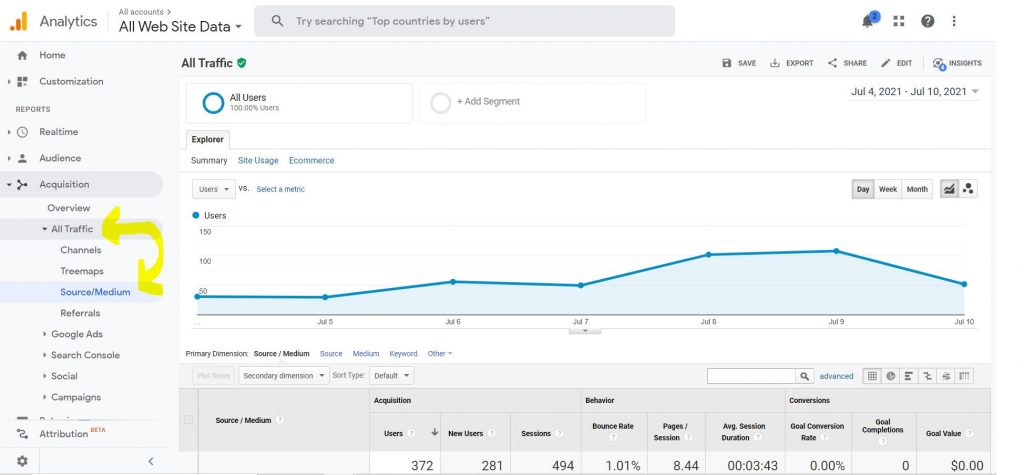
To help you find the data you need for website traffic, you can begin by heading to your Google Analytics dashboard and then clicking on Acquisition > All Traffic > Channels.
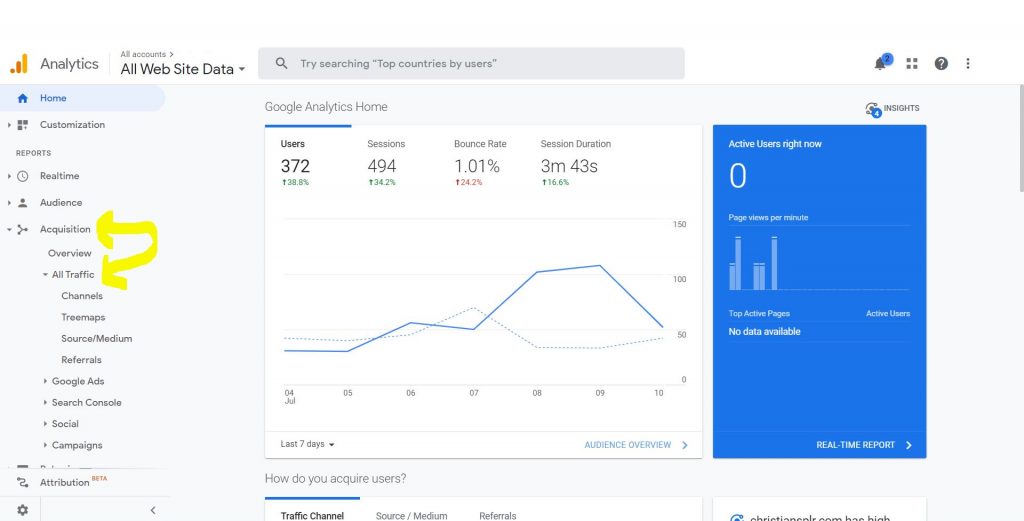
You will then be presented a Google Analytics web traffic report of your website. This is where you can view which channels are bringing in the most traffic. Channels are normally grouped into 4 categories:
- Direct – These are website visits where a user came directly to your website. For example, a person typed in your url in the browser versus searching for your website on a search engine or clicking a link from an email.
- Referral – These are website visits where a user came from another website. This can include social media sites such as Facebook, blogs, or affiliates.
- Organic Search – These are website visits that resulted from a search results page. Some used a major search engine, such as Google, for a keyword, your websites appeared, and the user clicked on your link in those results.
- Other – Any other website visit that can be categorized into the other three categories.
If you want a more in-depth look, you can click on the Source/Medium report under All Traffic. Doing so will narrow down a traffic source together with the channel.
How to View Traffic Sources for a Specific Page
To view traffic sources for a certain page linked to your Google Analytics account, go to Behavior > Site Content. In this section, you can choose if you want to view the traffic sources of all pages on your websites, those from landing pages, or for exit pages.
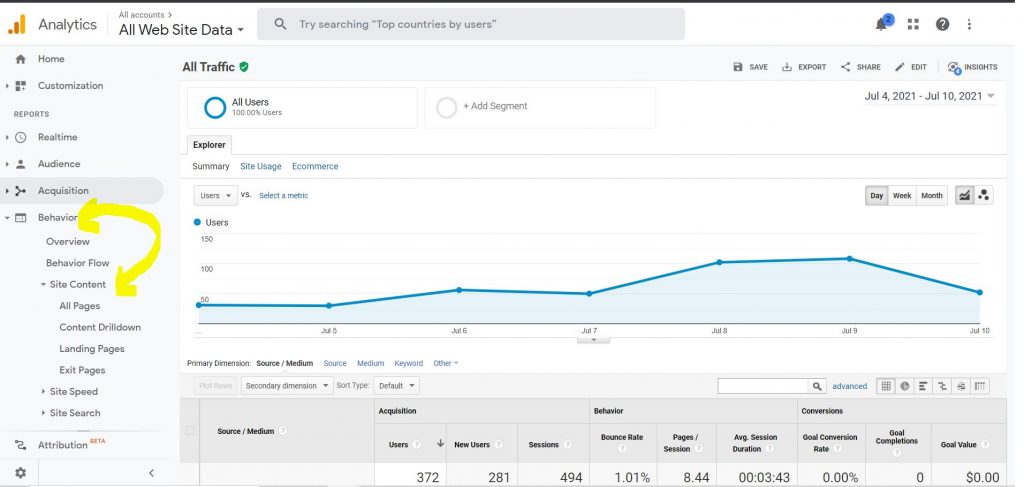
For your chosen page, click Secondary Dimension and then look for Source/Medium, which can be found under Acquisition.
You will then be presented with a list together with the sources of traffic. These are the websites your visitors come from before arriving at your own.
How to View Which Pages People Visit
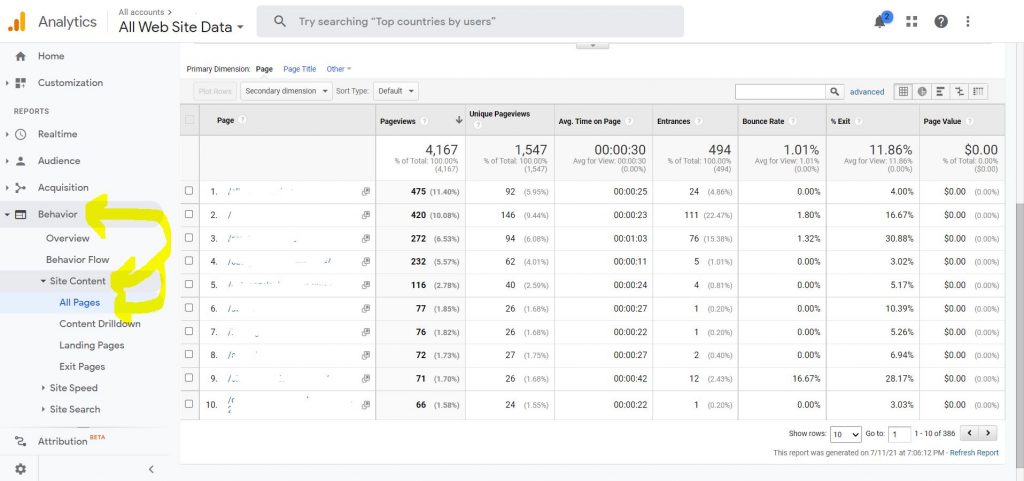
If you want to know which pages of your website people visit, click Behavior > Site Content and you will find the “All pages” report. This report will show you the pages that were visited based on your chosen period.
At the bottom of the report, you can view the total number of unique pages that people visited on your website.
And that’s it! Now you know how to view the traffic to your website and specific pages using Google Analytics. You also learned how to check which pages people visited.
This information is incredibly useful when monitoring your website traffic. It can help you make content and product decisions going forward to ultimately help you reach your target audience and increase your income.
The Google Analytics Dashboard
You can set up your own custom reports to show metrics about your website’s performance. These dashboards provide us with an overview of the most vital information we need to accomplish our website goals – making conversions. Google allows us to create custom dashboards filled with widgets such as timelines, metrics, tables, and charts to show us all sorts of data.
Timelines show specific data over the course of a specific time period.
Metrics show specific data as a single number. For example, the total number of user sessions for the past 30 days is 1,555.
Tables use rows and columns to visualize data. For example, a table might include a list of all referral urls and how many sessions came from each referral url.
Charts are used to visualize part of the data in relation to the whole. These could be used to compare conversions from different traffic sources such as referrals, social media, organic search, etc.
To locate any existing dashboards, log in to your Google Analytics account, then click on Customization > Dashboards. The next section will show you every dashboard that you have, along with the date they were created.
Clicking on a dashboard will show you all of the widgets that were added and the latest data from Google Analytics. This section will be empty if you do not have any dashboards yet.
How To Set Up a Google Analytics Dashboard
Begin by clicking Customization > Dashboards and then clicking on the “Create” button. A popup will be displayed showing two choices: blank canvas and starter dashboard.
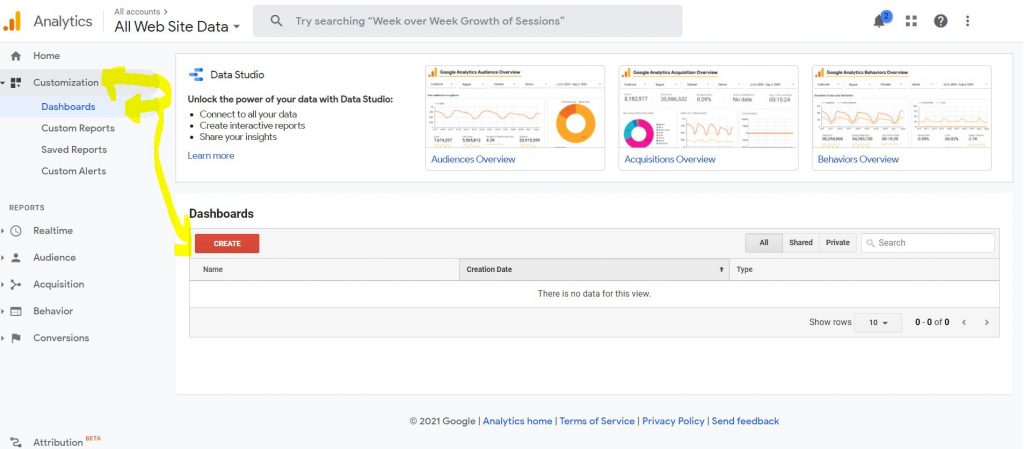

You can also import a dashboard from the gallery, which are premade dashboards from Google and other third parties.
This is where you can give your dashboard a unique name, which is a good idea if you plan to have more than one dashboard showing different types of data. You can have up to 20 different dashboards and each dashboard can display a max of 12 widgets.
You can use the starter dashboard to set one up quickly. Once you have selected a template and named your dashboard, click the “Create Dashboard” button.
The new custom dashboard will now be available for you to see.
The beginner dashboard comes with widgets for new users, sessions, sessions by browser, bounce rate, goal completions, and more.
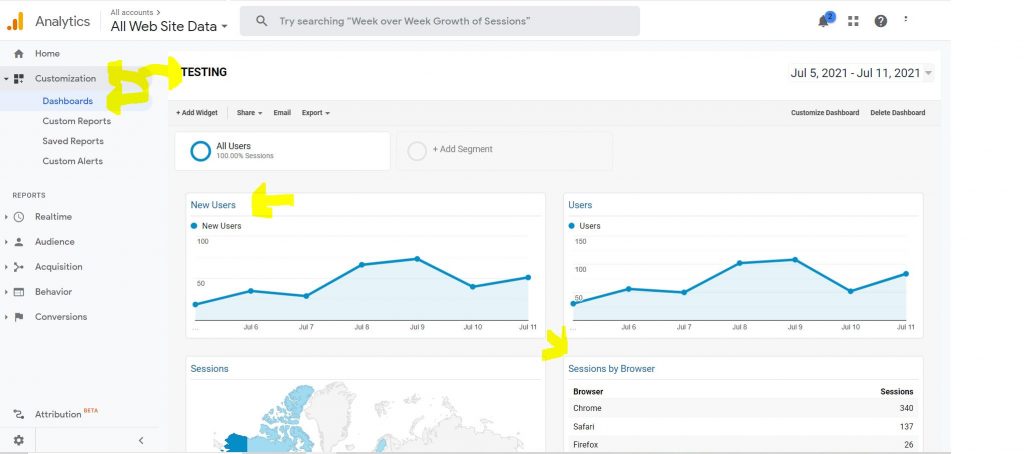
You can customize your dashboards to let them show you specific details you need from Google Analytics.
Another option is to do a search for google analytics custom dashboards you will find hundreds of premade dashboards you can import and use. No point in recreating the wheel if one of the premade dashboards will provide you with the data you need.
The Google Analytics Dashboard is an important part of analyzing the statistics of your website and now that you know how to create a starter dashboard, you can customize how the data is displayed in a way that works best for you. Just remember analytical data is only good if you review it regularly and put the data to use.